Tuesday, December 13, 2011

How to use PI ProcessBook to monitor Mass Balance for Batch Processes


This one time - we were harvesting a production bioreactor with several million dollars worth of product - an operator left a valve open and 33% of product went to drain. The plant manager (VP) was fuming mad - rightfully so.

"I pay for all this monitoring software, how come no one could tell that a valve was open?"

It's a good question. I drifted off thinking that we didn't have a tag for every valve indicating whether or not it was open.

"We need a mass balance," he said to no one in particular.

And then I realized we could have a mass-balance since we have load cells on the bioreactor and harvest tank, as well as a flow totalizer on the centrifuge. In the case of biologics processing, we are dealing with constant density volumes, which means that a mass-balance is often the same as a volume balance. The pipes between the bioreactor and the centrifuge holds volume (called "hold-up"), as well, there is hold-up between the centrifuge and the harvest tank.

bioreactor, centrifuge, harvest tank volumes
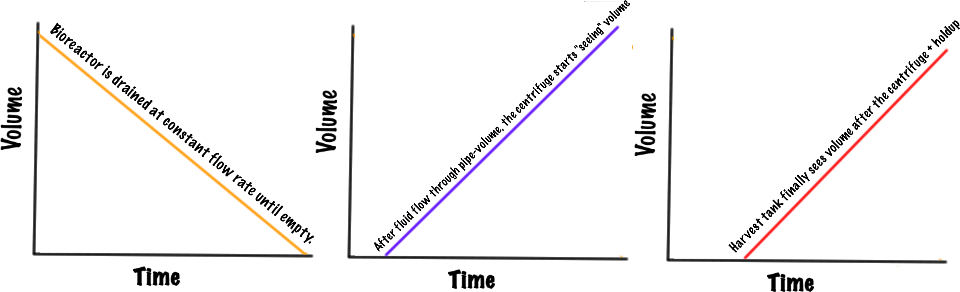
Plotted on the same trend using PI ProcessBook we get something like this:

ProcessBook mass balanced
From this perspective, we can easily determine if there is volume-loss between the centrifuge and the harvest unit by looking at the slopes: if the slopes are the same and the lines are parallel, we have no mass-loss. But it's hard to tell if there is any loss of mass between the bioreactor and the centrifuge since the line is downward sloping.

There's a trick in PI ProcessBook where you can simply reverse the Max and Min for the trace making the bottom axis the larger number and the top axis the smaller number:

ProcessBook Define Trend Scales
This simply makes the top of the trend the small number and the bottom of the trend the larger number. Be sure to use Multiple Scales so only this tag is plotted upside-down. What you get is a trend where everything is sloping upwards:

ProcesBook trend mass balance
This trend shows that the mass is balanced (i.e. no losses in the closed system).

But suppose there is a valve open on the line between the fermentor and the centrifuge... what does that look like?

ProcesBook trend Mass Balance Losses
In this case, we see that the slope of the totalized volume processed by the centrifuge is less than the slope of the fermentor. Literally, the rate of volume lost by the fermentor is greater than the rate of volume gained by the centrifuge... the difference is the amount gone down to drain.

Likewise, should there be losses just between the centrifuge and the harvest unit, the totalized volume of the centrifuge and fermentor volumes should match in slope, while the harvest unit should have a lesser slope.

ProcesBook trend mass balance losses
PI ProcessBook is ideal for monitoring your process... especially if you need to know something in real-time (e.g. "Hey, there's a valve open and it shouldn't be").

In biologics manufacturing, there really is no excuse for having losses like these when we can monitor the entire system and prevent significant (in this case, seven-figure) losses in our operations.

Get Proven Biopharma PI Displays

Friday, December 2, 2011

FDA on pace for record year issuing 483s

FDA Form 483Zymergi serves companies that run cell culture and fermentation processes. Nearly all our customers produce biologics... molecules that are synthesized by biological organisms - and all of them get their GMP plants inspected by the FDA.

Yesterday, FDAzilla published the rate the FDA hands out inspection observations called 483 for 2011. It's eye-popping; on average, they hand out 1 (Form) 483 every 50 minutes.

If you need more information on avoiding headache with the inspectional liability side of running cell culture/fermentation processes, go ahead and visit:


Friday, October 28, 2011

Example of Production Culture KPI: Volumetric Productivity


Say you are running a 2g/L product from a ten-day process at your 1 x 6000L plant, with strict orders from management to minimize downtime. This product is selling like gangbusters, which means every gram you make gets sold, which means you've got to make the most of the 80-day campaign allotted for this product.

The volumetric productivity for the process is 2g/L/10days = 0.2 g/L/day.Running a 6000L capacity plant gives you
  • 12 kilos every 10 days.
  • 8 run slots given the 80-day campaign
  • Maximum product is going to be: 96 kg for the campaign.

But suppose your Manufacturing Sciences team ordered in-process titer measurements and found that Day 8 titers were 1.8 grams per liter. in process titersHarvesting at day 8 means:
  • 10.8 kilos every eight days.
  • 10 run slots given the 80-day campaign
  • Maximum product is going to be 108 kg.
By harvesting earlier, you gain two additional run slots... during which time you can make 21.6 kg; but since you lost 1.2 kg/run for 8 runs totalling 9.6 kg, the net gain is 12 kgs.

There are a lot of assumptions here:
  • Your raw material costs are low relative to the price at which you can sell your product
  • Your organization is agnostic to doing more work (ten runs instead of eight).
It is difficult for plant managers to end a culture early to get 10.8 kgs when simply waiting two more days will get you 12 kgs. It quickly becomes easy when you see how two-run slots open up and you have the opportunity to make 21.6 kgs to make up for the lost product from ending the fermentation early, or rather, the point of maximum volumetric productivity.


Wednesday, October 26, 2011

How to Compute Production Culture KPI


Production culture/fermentation is the process step where the active pharmaceutical ingredient (API) is produced. The KPI for production cultures relates to how much product gets produced.

The product concentration (called "titer") is what is typically measured. Operators submit a sterile sample to QC who have validated tests that produce a result in dimensions of mass/length3, for biologics processes, this is typically grams/liter.

Suppose you measured the titer periodically from the point of inoculation; it would look something like this:

titer curve typical production culture
The curve for the majority of cell cultures is an "S"-shaped, also called "sigmoidal," curve. The reason for this "S"-shaped curve was described by Malthus in 1798 where he described population growth as geometric (i.e. exponential growth) while increases in agricultural production was arithmetic (i.e. linear); at some point, the food supply is incapable of carrying the population and thus the population crashes.

In the early stages of the production culture, there is a surplus of nutrients and cells - unlimited by nutrient supply - grow exponentially. Unlike humans and agriculture, however, a production fermentation does necessarily have an increasing supply of nutrient, so the nutrient levels are fixed. Some production culture processes are fed-batch, meaning at some point during the culture, you send in more nutrients. Regardless, at some point, the nutrients run low and the cell population is unable to continue growing. Hence the growth curve flattens and basically heads east.

In many cases, the titer curve looks similar to the biomass curve. In fact, the integral (area under that biomass curve) is what the titer curve typically mimicks.

The reason this titer curve is so important is because the slope of the line drawn from the origin (0,0) to the last point on the curve is the volumetric productivity.

Volumetric Productivity
Titer/culture duration (g/L culture/day)

The steeper this slope, the greater the volumetric productivity. Assuming your bioreactors are filled to capacity and that supplying the market with as much product as fast as possible, then maximizing volumetric productivity ought to be your goal.


Counter-intuitively, maximizing your rate of production means shortening your culture duration. Due to the Malthusian principles described above, your titer curve flattens out as your cell population stagnates from lack of nutrients. Maximizing your volumetric productivity means stopping your culture when the cells are just beginning to stagnate. End the culture early and you lose the opportunity cost of producing more product; end the culture late and you've wasted valuable bioreactor time on dying cells.

The good news is that maximizing your plant's productivity is a scheduling function:


  1. Get non-routine samples going to measure the in-process titer to get the curve.
  2. Study this curve and and draw a line from the origin tangent to this curve.
  3. Draw a straight line down to find the culture duration that maximizes volumetric productivity.
  4. Call the Scheduling Department and tell them the new culture duration.
  5. Tell your Manufacturing Sciences department to control chart this KPI to reduce variability

There's actually more to this story for Production Culture KPI, which we'll cover next.


Tuesday, October 25, 2011

How to Compute Seed Fermentation KPI


So,  if you agree that the purpose of seed fermentation (a.k.a inoculum culture) is to scale-up biomass, then the correct key performance indicator is final specific growth rate.

To visualize final specific growth rate, plot biomass against time:


The cell density increases exponentially, which means on a log-scale, the curve becomes linear. The specific growth rate (μ) is the slope of the line. The final specific growth rate (μF) is the slope of all the points recorded in the last 24-hours prior to the end of the culture.

To compute the final specific growth rate, simply put datetime or culture duration in the first column, biomass in the second column, and the natural log of biomass in the third column:

tabular inoc culture kpi
In Excel, use the SLOPE function to compute the slope of the natural log of biomass:

=SLOPE(C5:C7,A5:A7)
Alternatively, if you don't want to bother with the third column:

=SLOPE(LN(B5:B6),A5:A7)
This number has engineering units of inverse time (day-1). While this measure is somewhat hard to physically understand, we look towards the ln(2) = 0.693 as a guide: If a culture has a specific growth rate ~ 0.70 day-1, then its cell population is doubling once per day.

Computing this KPI for seed fermentation and then control charting this KPI is the best start you can make towards monitoring and controlling your process variability.


Monday, October 24, 2011

KPIs for Cell Culture/Fermentation


Control charting each process step of your biologics process is a core activity for manufacturing managers that are serious about reducing process variability.

Sure, there's long-term process understanding gained from the folks in manufacturing sciences, but that work will be applied several campaigns from now.

What are the key performance indicators (KPIs) for my cell culture process today?

To answer this question, start with the purpose(s) of cell culture:
  1. Grow cells (increase cell population)
  2. Make product (secrete the active pharmaceutical ingredient)

Seed Fermentation (Grow Cells)


There are plenty of words that describe cell cultures whose purpose is to scale-up biomass; to wit, seed fermentation, inoculum cultures, inoc train etc. Whatever your terminology, the one measurement of seed fermentation success is growth rate (μ), which is constant in the exponent of the Arrhenius equation:

X = X0eμΔt

Where:
  • X = current cell density
  • X0 = initial cell density
  • Δt = elapsed time since inoculation

For seed fermentation, the correct KPI is the final specific growth rate; which is the growth rate in the final 24-hours prior to transfer. The reason the final specific growth rate is the KPI is because the way seed fermentation ends is more important than how it starts.

Production Fermentation (Make Product)


The output of the Production Fermentor is drug substance; the more and the faster, the better. This why the logical KPI for Production Fermentation is Capacity-Based Volumetric Productivity.

A lot of folks look at culture titer as their performance metric. Mainly because it's easy. You ship those samples off to QC and after they run their validated tests, you get a number back.

Culture Titer
Mass of product per volume of culture (g/L culture)

The problem with using culture titer is that it does not take into account the rate of production of product. After all, if it took culture A takes ten days to make 2g/L and culture B takes 12 days to make the 2g/L, according to titer, they are equivalent, even though A was better. This is why we use volumetric productivity:

Volumetric Productivity
Titer/culture duration (g/L culture/day)

Culture volumetric productivity takes into account the rate of production pretty well, and in our example culture A's performance is 0.20g/L/day while culture B's performance is 0.17 g/L/day. But what of the differences between the actual amount of product manufactured? I can run a 2L miniferm and get 0.40g/L/day, but that isn't enough to supply the market. This is why bioreactory capacity must be included in the true KPI for production cultures.

Capacity-based Volumetric Productivity
Volumetric Productivity * L culture / L capacity (g/L capacity/day)

Capacity-based Volumetric Productivity is the Culture Volumetric Productivity multiplied by the percent of fermentor capacity-used, such that a filled fermentor scores higher than a half-full fermentor.

KPIs are generally not product-specific; instead, they are process class specific. For instance, all seed fermentation for CHO processes ought to have the same KPI.

Generally, KPIs are simple calculations derived from easily measured parameters such that the cost of producing the calculation is insignificant relative to the value it provides.

KPIs deliver significant value when they can be used to identify anomalous performance and actionable decisions made by Production/Manufacturing in order to amend the special cause variability observed.


Monday, October 17, 2011

PIModuleDB: "It's What Makes PI Batch Possible!"


In addition to correlating unit/alias to tags, the PI Module Database is the foundation for PI Batch, in fact, it is a requirement.

You see, there's a special type of module called, "PIUnit". And the main difference between a PIUnit and a regular module is that a PIUnit can keep track of start/end times (a.k.a. PIUnitBatches or UnitProcedures as defined by S88).

If you go to your Module Database, you can discern modules from piunits because they have different icons. The Module looks like a red/yellow/green cube with an "M" in the center of it. The PIUnit looks like a half-filled tank of water with pipes in and out.

Edit PIUnit PIModuleDB

When you right-click on the PIUnit and select Edit, the following form will present itself:

Edit View PIModule Attributes

Pay particular attention to the Unique ID attribute of the PIUnit. The key here is that when you create a PIUnit, the PI server will create a PIPoint (a tag) for the purpose of storing PIUnitBatches.

You can prove it to yourself by doing a tag search on that gibberish text. In my case, I went straight to the PI SMT > Data > Archive Editor

PIUnit uniqueID is tag

What's more is that these events correspond with the unitbatches stored in PI Batch. The batch information about the batchid, product, procedure and endtime are stored at the starttime of the batch.

uniqueID is tagname that stores batches
You see, PI Batch is rationally a simple table... one with 7 columns and as many rows as you have batches. But if you are OSIsoft and alls you have is PI (hammer), everything starts looking like a tag (nail).

This is why PI Batch Database... while seemingly tabular... is actually a data structure that is a hybrid of the hierarchical structure presented by the PI Module Database and PI tags. What makes PI Batch possible is that uniqueID of a PIUnit in PIModuleDB is the name of the tag that archives unitbatch information.


Tuesday, October 11, 2011

SQLite Insert Rate ranges from 50 to 250 inserts/second.

SQLite is a file-based database. It's used in browsers, it's used on your iPhone. We use it as a placeholder for RDBMS. We're troubleshooting a data-write problem and it turns out that the problem is somewhere else.

Our hardware is WinXP 32-bit, Lenovo laptop running SQLite.NET and plotted here is the number of rows inserted per second.

sqlite inserts per second

If you have an application that needs no more than 30 inserts/second, SQLite works just fine.


Wednesday, September 28, 2011

Troubleshooting OSI PI compression


I just got back from a client where I was getting a copy of their PI server configuration. My customer offhandedly asked me about the size of his archives- "Is it normal to use 600 megabytes every 2 days?" Off-the-bat, I could tell there was something wrong with the data compression of this system. This PI server was < 5000 points and it collects data from about 20 production units.

Customers with similarly sized-plants and run-rates burn through 600 megabytes a MONTH. The largest cell culture facility west of the Mississippi goes through 1000 megabytes a month, so this particular client was definitely looking at something obvious and something that is statistically outside of normal.

Here's how I troubleshot it:

Look for compressing = 0


The PI Point attribute that determines if the data to a point is to be compressed is the compressing attribute. This value ought to be 1. A lot of people like turning this off for low-frequency tags but it's like unprotected copulation - you're not necessarily going to get pregnant, but there's a chance that an errant configuration runs your system down.

Look for compdev = 0


The compdev point attribute determines what data makes it into the archive. Compdev settings ought to be 0.5 instrument accuracy according to solid recommendations on PI data compression for biotech manufacturers. If you find yourself loathe to define this number, I'd make compdevpercent = 0.1. What this does is it eliminates repeats from the archive.

Use PI DataLink to look for diskspace hogs


The easiest way to identify which tags are the culprit is to pull it up in PI DataLink and use the Calculated Tag feature to find tags with high event count. Start by looking in the last hour... then in the last 12-hours, then last day, then last week. The blatant offenders should be obvious within even 1-minute.

In the case of my customer, he had 7 tags out of about 5000 that was uncompressed. Each of these 7 tags was collecting 64 events/sec. 3840 events/minute. 5.5 million events per day. All told, these 7 tags were recording 39 million zeros into the archive per day... burning through diskspace faster than Nancy Pelosi likes to spend your income.

Modern hardware has made these problems insignificant, but burning through diskspace is a latent problem that rears its head at the most inopportune moment.

download-our-whitepaper

and learn about OSIsoft's data compression settings and what they ought to be.


Tuesday, September 27, 2011

Version Control

GMP environments require very strict control. Whether or not regulations mandate them, controlling the process and the manufacturing formula is, frankly, a good idea.

The problem with controlling GMP documents and GMP control-system recipes is the onerous change-control process that has evolved over the years. And my observation of this change-control process is that it was design by regulators and not computer scientists.

It's important to bring out computer scientists because managing source code is a core function of companies that develop software. In fact, version control is so sophisticated that it has become distributed and there are distributed version control systems (like Veracity DVCS) that can help cGMP-regulated companies manage their GMP documents and recipes.

I actually have yet to see version control software applied to GMP industries probably because people don't understand it nor how it works. In fact, only recently did I get a primer on it.

Eric Sink Version Control By Example Book CoverThat primer came in the form of the beginner book on version control called "Version Control By Example" by a fellow named Eric Sink. And while he may not have written this book for QA managers in big pharma... every QA/CC manager in big pharma ought to have a copy of his book.

It goes through the evolution of change control. It talks about central repositories and how the industry is moving towards distributed repositories. It imbues the newbie reader with a shared vocabulary so that people who understand the importance of version control can express their needs to people who write version control software. Get a print version from Amazon here.

At Zymergi, we believe that future of QA change control and document management is to turn to proven methods and technology. And looking to the technical folk in the software version control space is where I think the robust solution lies.


Monday, September 26, 2011

OSI PI streaming data compression


The purpose of data compression in the PI server is to save disk space. I heard a story from the CEO of OSIsoft that the first PI server used a 10 Megabyte hard drive and in the 80's, that hard drive cost a $250,000 dollars.

And as hard drives became easier to make and the cost per megabyte plummeted, people think that the data compression is a legacy component that isn't worth thinking about. In fact, I've had people think throwing money at the problem makes it go away. The problem doesn't go away, and here's why:

The value of PI comes from putting expert eyeballs on trends. If it takes longer to load trends because the archive is filled with uncompressed and redundant data, then those eyeballs are going to view less trends. The cost of curiosity increases every so slightly and over time, you lose.

2 days to burn 600MB
From an IT perspective, liberal compression settings means more hard disk consumption. I've seen a GMP plant use 300 megabytes per day. that's 100 gigabytes a year. "Hold on," you say, "100 GB SSD hard drive will cost you $150... that's less than the cost of the Change Record!" True... but over time keeping years of archive data online means you're going to need to keep upgrading the hardware.

Backing up the same amount of data will cost 10X the time. It's just unwieldy, especially when you're talking about simply setting:
  • compressing=1
  • compdev > 0.

Think about your data compression. Do some research on what they ought to be. In fact, get the Zymergi whitepaper on OSI PI compdev and excdev emailed to you for free.

download-our-whitepaper

PI data compression is a set-it-and-forget-it activity. Do it right the first time and you basically never have to think about it again.


Tuesday, September 20, 2011

Upgrading to PI Server 2010 for PI Batch Users


PI Server 2010 is the latest PI server offering from OSIsoft. I don't know for a fact, but this seems like a marketing nomenclature to emulate Microsoft's Office 2007, Windows Server 2008...etc. It'll remind me the way my Office 97 makes me feel 14-years behind the times.

Whatever the case, the internal versioning system remains the same: PI Server 2010 is still version 3.4.385.59. What is drastically different is that PI Server 2010 requires (mandates/coerces) users to have PI Asset Framework (PI AF).

Ok, so what's PI AF? PI AF is essentially a scaleable PI Module Database, and what makes it scaleable is that it's built on Microsoft SQL Server. This means that you need to have SQL Server (or SQL Server Express) installed somewhere. Over time, the PI Module Database will be deprecated in favor of PI AF. So the default behavior of the PI Server 2010 is to copy the ModuleDB to PI AF and put it in read-only mode.

The problem is that there are PI applications that use PI ModuleDB that have NOT been moved to PI AF... for us in biotech, that's PI Batch. So in order to keep these customer happy, OSIsoft provides an option for PI AF to be synchronized with PI ModuleDB, but this requires preparation. The PI MDB to AF Preparation Wizard is what achieves this and this wizard comes with PI SMT 2010... which means you need to install PI SMT 2010 next.

Once the PI MDB to AF Preparation Wizard is run and all the errors fixed, you can proceed with upgrading your PI server to PI Server 2010.

How to Upgrade to PI Server 2010 resized 600

This gives you the overview of upgrading to PI Server 2010. This upgrade is not as straightforward as previous upgrades because of the AF mandate. The devil is in the details and you should run through this process several times before apply it in the GMP environment.


Friday, September 16, 2011

OSI PI BatchDB: Batch Generator - part 2


So we know about the data structure storing time-windows in PI. How do we get the actual data into this data structure? And once we get it in, how do we fetch it in order to use it?

Well, if you have an older system with no batch manager, then the answer is the PI Batch Generator (PI BaGen), software that reads from a data source and sends it to PI. In the case of the PI BaGen, the data source is PI tags, and sends the computed results to other PI tags.

Here's how it works:

You have a tag that reads 0 when a unit is not operating and it reads 1 when the unit is operating. In the case of fermentation, you could use the pH controller mode because you only turn on pH control when there is either media or there are microbes in the bioreactor. This tag is will be the Active Point for your unit.

Let's say you have another tag in which the operator inputs the batch identification... this is the UnitBatch ID Point. And again, when the PLC runs, the program name is written to another tag... this would be the Procedure Point.

With this information, you can fire up the PI System Management Tool (PI-SMT) and configure UnitBatches to be automatically generated for your unit.

PI BaGen SMT

The purpose of the post is not to walkthrough a PI Batch Generator configuration, but to help you identify the pre-existing conditions conducive of using the PI Batch Generator interface. (The OSI documentation for PI BaGen is the right place to start).

OSI PI's BatchDB is an exceptional tool... especially for users in the biologics manufacturing space. Configuring PI Batch is a no-brainer, especially if you run a batch process and want to increase productivity by no less than 400%.


Wednesday, September 14, 2011

OSI PI Batch Database (BatchDB) for biologics lab and plant - part 1


Biologics manufacturing is a batch process, which means that process steps have a defined starttime and endtime.

CIPs start and end. SIPs start and end. Equipment preparations start and end. Fermentation, Harvest, Chromatography, Filtration, Filling are all process steps that start and end.

Even the lab experiments are executed in a batch manner with defined starts and end.

Like the ModuleDB, OSIsoft has a data structure within PI that describes batch and it is called PI Batch Database (PI Batch). While it comes free, it does cost at least 1 tag per unit (PIUnit) to use.

The most important table is the UnitBatch table. The UnitBatch table contains the following fields:
  • starttime
  • endtime - when the batch happens
  • unit - where the batch happened (with which equipment)
  • batchid - who (name of the batch)
  • product - what was produced?
  • procedure - how was it produced?

PIBatchIn essence, the UnitBatch table describes everything there is to know about a process step that happens on a unit. Remember: units are defined in the PI ModuleDB, which means the PI BatchDB depends on a configured PI ModuleDB.

So why bother configuring yet another part of your PI server? The main reason is to increase the productivity of your PI users. In our experience, up to 50% of the time spent using PI ProcessBook inputting timestamps into the trend dialog. Configuring PI Batch makes it so that your users can change time-windows in ProcessBook with just a click.

We have seen power-users put eyeballs on more trends in even less time than without PI Batch; and the more trends your team seems, the more process experience they gain.

In this dismal economic environment, simply configuring PI Batch on your PI server can make your team up to 400% more productive. This particular modification takes less than a day to accomplish.


Friday, September 9, 2011

Multivariate Analysis in Biologics Manufacturing


All these tools for data acquisition and trend visualization and search are nice. But at the end of the day, what we really want is process understanding and control of our fermentations, cell cultures and chromatographies.

Whether a process step performs poorly, well or within expectations, put simply, we want to know why. 

For biological systems, the factors that impact process performance are many and there are often interactions between factors for even simple systems such as viral inactivation of media.

One time,  clogged filters with white residue were the result when transferring media from the prep tank to the bioreactor. On several occasions, this clogging put the transfer in hold and stopped production.

After studying the data, we found that pH and Temperature were the two main effects that significantly impacted clogging. If the pH was high AND the temperature was high, the solids would precipitate from the media. But the pH or temperature during the viral inactivation was low, the media would transfer without exception.

After identifying the multiple variables and their interactions, we were able to change the process to eliminate clogging as well as simplify the process.

For even more complex systems like production fermentation, multivariate analysis produces results. In 2007, I co-published a paper with Rob Johnson describing how multivariate data analysis can save production campaigns. From the article is the regression pictured below.

Multiple Linear Regression

You can see that it isn't even that great a fit. Statisticians shrug all the time at RSquares less than 0.90. But from this simple model, we were able to turn around a lagging production campaign and achieve 104% Adherance To Plan (ATP).

The point is not to run into trouble and use these tools & know-how to fix the problem. Ideally, we understand the process ahead of time by designing in-process capability and then fine tune it at large-scale; we are less fortunate in the real world.

My point in all this is if you are buying tools and assembling a team without process understanding and control,  then you won't know which are the right tools or what is the best training. Keeping your eye on the process understanding/multivariate analysis prize will put you in control of your bioprocesses and out of the spotlight of QA or the FDA.


Thursday, September 8, 2011

Process Capability (CpK)


From a manufacturing perspective, a capable process is one that can tolerate a lot of input variability. Said another way, a capable process produces the same end result despite large changes in material, controlled parameters or methods.

As the cornerstone of "planned, predictable performance," a robust/capable process lets manufacturing VPs sleep at night. Inversely, if your processes do not tolerate small changes in materials, parameters or methods, you will not make consistent product and ultimately end up making scrap.

To nerd out for a bit, the capability of a process parameter is computed by subtracting the lower specification limit (LSL) from the upper specification limit (USL) and dividing this by the standard deviation measured of your at-scale process:

1fc1cbd2a59a0da04cb5e11abc816b77[1]

The greater the Cp, the more capable your process. There are many other measures of capability, but all involve specifications in the numerator, standard deviation in the denominator and values of 1 or greater means "capable."

A closer look at this metric shows why robust processes are rarely found in industry:

  • Development sets the specifications (USL/LSL)
  • Manufacturing controls the at-scale variables that determine standard deviation.

And most of the time, development is rewarded for specifications that produce high yields rather than wide specifications that increase process robustness.

Let's visualize a capable process:

cc

Here, we have a product quality attribute whose specifications are 60 to 90 with 1 stdev = 3. So Cp is (90-60)/6*3 = 30/18 = 1.6. The process has no problems meeting this specification and as you can see, the distribution is well within the limits.

Let's visualize an incapable process:

ncnc

Again, USL = 90, LSL = 60. But this time, the standard deviation of the process measurements is 11 with a mean of 87.

Cp = (90 - 60)/ 6 * 11 = 30/66 = 0.45. We can expect the process to meet the specification approximately 45% of the time.

Closer examination shows that the process is also not centered and vastly overshoots the target; even if variability reduction initiatives succeeded, the process would still fail often because it is not centered.

If you are having problems with your process reliably meeting their specifications, apply capability studies to assess your situation. If you are not having problems with your process, apply capability studies to see if you are at risk of failing.

The take-away is that process robustness is a joint manufacturing/development effort, and manufacturing managers must credibly communicate process capability to development in order to improve process robustness.

Get a Proven Biotech SPC Consultant

Wednesday, September 7, 2011

PI ProcessBook Is A Trend Visualization Tool, Not An Analysis Tool


ProcessBook is the trend visualization tool written by OSIsoft for their PI system. It is what is called a rich-client, which basically means that it is installed on your local computer and uses your computer's CPU to give the users a rich set of features. Because PI ProcessBook is how users interact with PI, this program is often confused for the PI system itself.

Our customers really like PI (the server) and ProcessBook (the client) - so do we - and sometimes fall in the trap of thinking that PI should be everything to everyone. And why shouldn't they?

ProcessBook provides everything you need for real-time monitoring. One time, I was watching this oxygen flow control valve to my bioreactor flicker on and off. I verified this was abnormal behavior by checking the O2 flow control valve tag from history. I called to the plant floor and met up with the lead technician in the utilities space to walk down the line and found that oxygen was actually leaking from it. There were contractors welding in that space at the time and though risks were low, we got them to stop until we fixed the problem.

Another time using ProcessBook, we saw a fermentor demanding base (alkali) solution prior to inoculation... something that ought not happen since there were no cells producing carbonic acid that required pH control. We called into the floor to turn off pH control to stop more base from going in. Confirmed the failed probe and switched to secondary. $24,000 of raw material costs were saved from looking at PI ProcessBook to see what the trends were saying.

The reason you don't put everything in PI (hence ProcessBook) is because ProcessBook is not an analysis tool. Analysis requires quantification. Good analysis applies statistics to let you know if differences you are measuring are significant. ProcessBook does not do that. It is there to help you put eyeballs on trends.

Spending funds to make PI ProcessBook into an analysis tool has a diminishing ROI. Your money is better spent elsewhere.

Get Expert OSI PI Pharma Consulting

Tuesday, September 6, 2011

OSI PI Module Database (ModuleDB)


The PI Module Database (ModuleDB) is a hierarchical data structure introduced by OSIsoft years ago. This hierarchical data structure comes free with every PI server and is often overlooked (people don't bother configuring it).

PIModuleDB
Example of PI ModuleDB


You see, the purpose of the ModuleDB is to account for the units of your physical plant. Perhaps you are a biologics manufacturing facility with bioreactors, mixing tanks, centrifuges and chromatography columns. Or perhaps you're a sulfuric acid plant with a blower, furnace and stack. You have equipment big and small whose I/O are sending data to the PLC/DCS that then send the data to PI. You can describe your physical units with the PI ModuleDB.

The big deal with the ModuleDB is that you get to associate these I/O (tags) with the unit to which they belong; and then you get to label (create an alias) that tag something other than the instrument address (which is gibberish to most people anyway). For example:

AIC447A05.VALUE

is not as memorable as
T447 Optical Density

The reason having unit/aliases is important is that it makes PI relevant; it brings PI tags closer to the community of users that talk about it. Walk around your plant and listen to the operators, supes, engineers and managers talk. Are they talking about the pH on Bay 1 or are they talking about AIC510A01.PV?

Chances are, their words refer to some parameter/measurement on the unit rather than to the tagname... which is mostly known by just the folks in automation or instrumentation.

Configuring the PI ModuleDB to represent your physical plant and then associating the relevant tags to those units via alias is a high-bang, low-buck activity that will pay dividends for years to come.


Wednesday, August 31, 2011

OSI PI Tag Compression Setting Recommendations


OSIsoft PI Tag data compression has been the subject of considerable debate for the regulated markets over the years. So much so that I wrote a paper about it almost 5-years ago.

Get the paper here: http://zymergi.com/osi-pi-data-compression-paper.htm

You see, GMP managers are reluctant to discard data the FDA calls "Original data." Yet other managers rationalize that disk-space is cheap... as are IT resources, so why not collect as much data as you can?

There are many reasons, but from the perspective of the user who has to go through that data, we want enough to study the process, but not so much that we're buried in the haystack.

This is where rational settings for data compression come into play. Data compression on OSI PI servers let you conserve on administration/IT costs, filter out useless data, while providing your scientific staff with "the right amount" of data for continuous process improvement.

By the same token, if you have thousands of PI Points, you may not have the resources to rationally examine each process measurement and come up with customized excdev and compdev settings for each.

So what’s the answer?

We think the answer is to understand that every instrument has error… the range of error is called, “Instrument accuracy.” Repeat values that are within that range are not different than the first value and ought to be filtered out.

We also think that if points are removed along a straight line that those points ought to be within one instrument accuracy of that line.

It turns out that setting excdev to instrument accuracy and compdev to 0.5 excdev is where this happens.

Get our FREE 3-page paper

It's an easy read.